With the cryptocurrency market continuing its volatile trends into 2025, traders are relying more than ever on technical analysis (TA) to predict price movements and make informed decisions. Whether you’re a beginner or a seasoned trader, understanding technical analysis can be the key to consistent profits in the crypto market.
In this post, we’ll explore the basics of technical analysis, the most effective indicators for 2025, and how you can apply these tools to improve your crypto trading success.
What Is Technical Analysis?
Technical analysis is the practice of using historical price data, trading volume, and chart patterns to forecast future price movements. Unlike fundamental analysis, which focuses on the value or news surrounding an asset, TA is purely data-driven.
Crypto markets, being highly speculative and emotional, often react to chart patterns and indicators, making TA particularly powerful in this space.
Why Technical Analysis Is Crucial in 2025
The 2025 crypto landscape is marked by increased institutional participation, algorithmic trading, and high-frequency market changes. With thousands of altcoins and dozens of exchanges, traders need a structured approach. Technical analysis helps by:
Identifying entry and exit points
Understanding market psychology
Reducing emotional decision-making
Improving timing for buying or selling
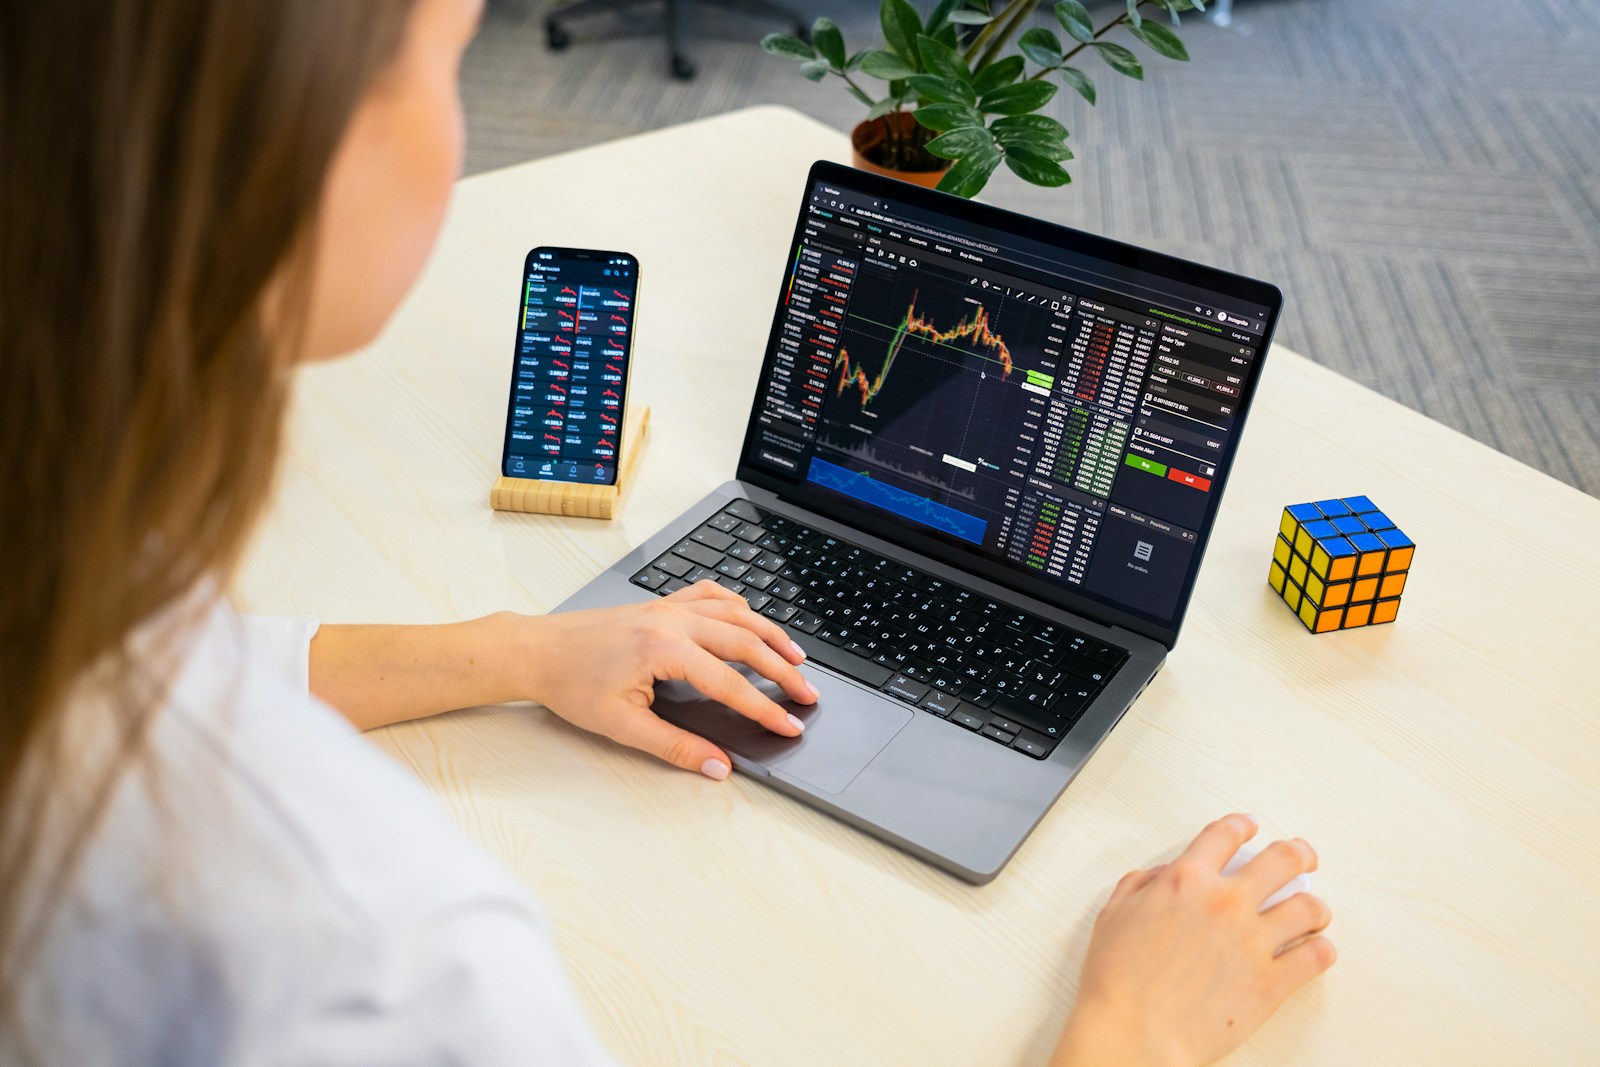
Essential Technical Analysis Tools for Crypto Traders
- Candlestick Charts
Candlesticks show open, close, high, and low prices for a specific time frame. Patterns such as Doji, Hammer, or Engulfing can signal trend reversals or continuations. - Moving Averages (MA & EMA)
Simple Moving Average (SMA) smooths out price data.
Exponential Moving Average (EMA) reacts more quickly to price changes.
Common strategies include:
Golden Cross (bullish signal): 50-day MA crosses above 200-day MA
Death Cross (bearish signal): 50-day MA crosses below 200-day MA
- Relative Strength Index (RSI)
RSI measures momentum. An RSI above 70 suggests overbought conditions; below 30 signals oversold. Traders use it to time entries and exits. - MACD (Moving Average Convergence Divergence)
MACD uses two EMAs to generate buy/sell signals based on crossover points and histogram strength. - Volume Analysis
Volume confirms the strength of price moves. Rising volume during an uptrend often indicates a sustainable breakout.
How to Apply Technical Analysis in Crypto
Start with the Trend: Use MA and trendlines to determine whether the market is bullish or bearish.
Use RSI and MACD Together: Confirm overbought/oversold zones before taking a trade.
Look for Support and Resistance: Identify key levels where price historically reverses.
Use Stop-Loss and Take-Profit: TA helps determine these levels logically, not emotionally.
Combine Indicators, Don’t Overload: Use 2–3 reliable indicators. More is not always better.
Common Mistakes to Avoid
Relying solely on indicators without context
Ignoring volume trends
Chasing hype without technical validation
Trading without a plan or discipline
Conclusion
Technical analysis is not about predicting the future with certainty but improving your odds of success. In 2025, with advanced charting tools, AI-driven signals, and global market volatility, TA remains one of the most valuable skills for any crypto trader.
Start small, practice on demo accounts, and gradually integrate TA into your trading strategy. Mastering the charts could be your edge in the fast-moving world of crypto trading.